Design and machine learning: Driving adoption through predictive analytics
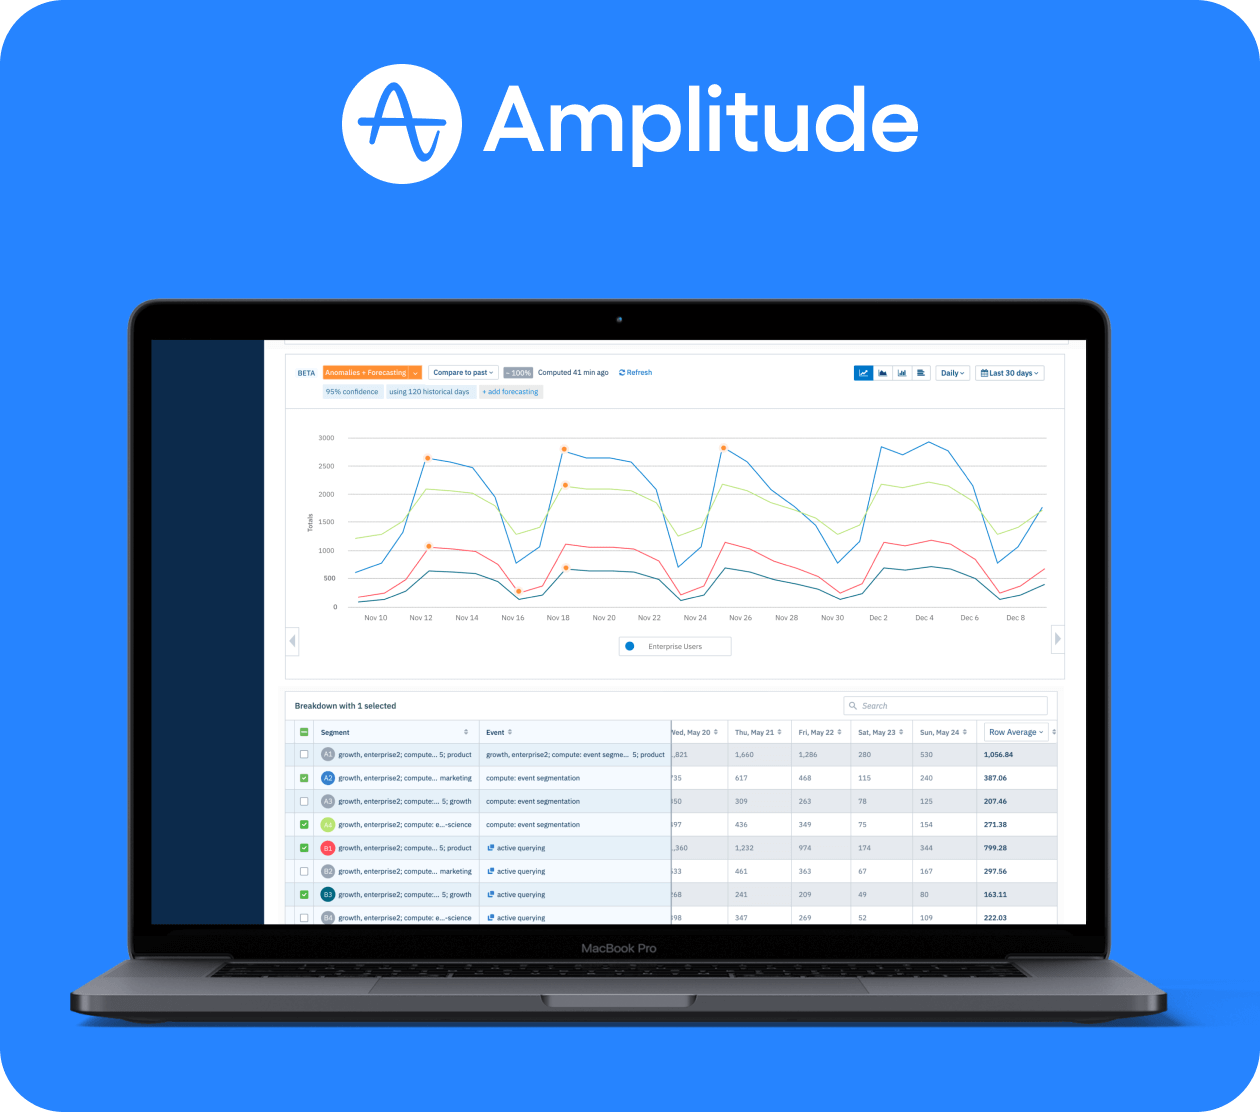
See how I helped design the first anomaly detection and forecasting feature at Amplitude, balancing clarity, trust, and actionable insights. This tool helps users spot meaningful changes in product metrics without manual guesswork, leading to reduced time-to-insight, improved trust in data, and empowered teams across 800+ customer accounts to act faster with confidence.
Overview
At Amplitude, I was part of the Growth team, a lean, high-impact group focused on rapidly validating ideas before committing them to the broader product roadmap. Our work helped de-risk big bets, prioritize high-impact opportunities, and inform long-term strategy across product teams.
In March 2020, we inherited the early anomaly detection and forecasting initiative from the analytics roadmap. With hiring frozen due to COVID-19, we were tasked with building a functional, validated foundation — fast. We collaborated directly with customers to prototype and refine the initial experience, laying the groundwork for future expansion by the core analytics team.
Amplitude’s users rely on the platform to monitor core metrics and understand their trends. However, the existing methods for evaluating metric fluctuations are often imprecise, leading to wasted time and resources investigating noise rather than meaningful insights. To solve this, I led the design of Amplitude’s first anomaly detection feature, developing an anomaly detection tool that helps customers distinguish significant metric changes from statistical noise. By identifying "what’s unusual in the data," users can focus on actionable insights and make informed decisions with confidence.
Anomaly detection was built to work across user segments, from data analysts to PMs and growth teams, without sacrificing flexibility or explainability. The feature offers three customizable modes to suit each segment:
- Agile Mode: Optimized for quick insights on recent data.
- Robust Mode: Accounts for seasonality by analyzing longer historical intervals.
- Custom Mode: Lets users set their own confidence intervals and analysis periods for tailored insights.
The feature was beta-tested with 900 customer accounts, with 17% engaging directly through in-app prompts. Since launch, one-third of Amplitude’s 2,400 paying customers (over 800 teams) now actively use Anomaly Detection in their workflows. This strong adoption rate highlights the feature’s success in solving a critical user pain point and delivering measurable value at scale.
Goals
- Enable users to detect statistically significant changes across any time series chart.
- Help users quickly recognize unexpected fluctuations to accelerate data-driven decisions.
- Add forecasting capabilities that leverage historical data to help users anticipate trends, set realistic goals, and make strategic decisions.
- Surface meaningful discoveries to drive product engagement and encourage collaboration across teams.
- Build a scalable foundation for anomaly detection and forecasting that maximizes long-term value while minimizing team overhead.
My role
- Designed an inline anomaly layer within dashboards and charts that can be toggled on or off
- Developed multiple visualization approaches (tooltips, confidence bands, UI highlights) to reduce visual noise and improve interpretability.
- Introduced forecast shading to show expected metric ranges and highlight statistically significant deviations.
- Defined and tested UX patterns for anomaly explanation, including confidence intervals and dynamic UI signifiers.
- Partnered closely with product analytics, design, and data science to align statistical thresholds with user trust and interpretability needs.
Research Insights
Testing early iterations with customers allowed us to gather valuable insights that informed both design and product decisions. During these sessions, we explored how customers currently find this information, how frequently they use the "compare to past" feature, and their expectations for an anomaly detection tool. Customers consistently emphasized the importance of ease of use, trust in the underlying model driving the computations, and confidence in selecting parameters to configure their output settings effectively. These insights shaped our approach to building a tool that feels intuitive and reliable.
- Intuitive Understanding: The experience should be easy to grasp at a glance, with thoughtful UX copy, tooltips, and affordances that guide users confidently through the workflow.
- Transparency Builds Trust: Users need visibility into how anomalies are detected. Surfacing the logic behind the system fosters confidence in its accuracy and reliability.
- Clarity in Detection: Anomalies should be instantly recognizable through thoughtful use of color, contrast, and visual cues that draw attention to meaningful changes.
- Guided Configuration: Parameter selection should feel approachable, with smart defaults and lightweight education that reduce friction and support confident decision-making.
A key friction point for users was understanding the “model” behind their charts, specifically, how results were calculated and whether they’d chosen the “right” parameters. While users trusted Amplitude’s analysis engine, many felt uncertain about configuring the tool correctly, especially those working alongside a data scientist to understand their insights. "How do I trust Amplitude's tool more than my data scientist?"
To address this, we proposed leveraging Amplitude’s existing credibility by introducing a set of predefined “modes” — industry-aligned parameter presets designed for common use cases. These modes helped remove ambiguity and empower users to focus on insights, not setup.
This approach delivered value in several ways
- Accessible for all personas: By reducing the need for technical fluency, modes supported a broader range of users across product, growth, and data teams.
- Reduced decision fatigue: Presets removed the guesswork, eliminating anxiety about choosing the wrong configuration.
- Progressive learning: Users could start with simplified defaults and grow into more advanced customization, supporting long-term confidence and skill development.
The solution
One consistent insight across research: users value smart defaults. These predefined parameters, surfaced through mode selection, gave users confidence without requiring deep configuration. For forecasting, we began with an intentionally minimal state, allowing users to layer in complexity as needed. This maintained discoverability while avoiding cognitive overload.
We introduced three distinct modes to support a range of needs:
- Agile: Optimized for responsiveness to recent trends using a 95% confidence interval and 120 days of training data.
- Robust: Tailored for stable, seasonal metrics with a full year of training data for stronger historical context.
- Custom: Enables advanced users to define their own intervals and training durations to fit specific use cases.
This tiered approach ensured that both novice and advanced users could extract meaningful insights without friction offering clarity by default and flexibility by design. Core features included:
- Forecast ranges overlaid on charts, enabling users to quickly identify when metrics deviated from expected trends.
- Inline anomaly flags that surfaced directly in existing dashboards and visualizations.
- Confidence indicators showing severity and likelihood of each anomaly, reducing false positives.
- Drill-in patterns that allowed users to investigate contributing segments or upstream causes with a single click.
- Explanation UI for each anomaly, including why it was flagged and what contextual factors might be related.
Balancing detail and visual simplicity
To reduce visual noise while still supporting rich exploration, we implemented hover-based interactions for anomaly segments. By default, the UI displays up to 10 segments — enough to surface patterns without overwhelming the viewer. On hover, additional context like confidence bands and forecast parameters is revealed inline, allowing users to explore deeper without cluttering the interface.
We also reserved a dedicated color token from Amplitude’s design system solely for anomalous data points. This distinct visual treatment helped anomalous values stand out clearly in a product otherwise dominated by shades of blue — preserving clarity in a dense visual ecosystem.
Interaction patterns that align with user expectations
Rather than a traditional on/off toggle, we implemented a button toggle to activate the feature. Early explorations using a toggle switch created inconsistency with Amplitude’s interface paradigms and introduced ambiguity about the feature’s state. The button model offered clearer behavior:
- Visual tags and color indicators signaled active state.
- When active, it applied the selected mode’s smart defaults immediately.
- Users could adjust parameters directly from the button interaction or via editable tags.
This solution minimized confusion, maintained platform consistency, and allowed for scalable interaction design in future enhancements.
Impact & outcomes
The anomaly detection feature redefined how teams used Amplitude for proactive product monitoring. Instead of relying on slow, manual comparisons, users now had real-time insights delivered in context.
- The feature was beta-tested with 900 customer accounts, with 17% engaging directly through in-app prompts
- Since launch, one-third of Amplitude’s 2,400 paying customers — over 800 teams — now actively use Anomaly Detection in their workflows
- Reduced dependency on analysts for interpreting common product shifts
- Shortened time-to-action for PMs and growth teams responding to regressions or spikes
- Validated a new strategic pillar for Amplitude’s analytics product line, allowing the team to focus on the final two parts of the anomalies and forecasting feature: real-time alerts and root cause analysis
This release dramatically simplified metric monitoring while improving anomaly literacy across teams.
Reflections
One of the biggest challenges was making the output of complex statistical models feel simple, usable, and credible to non-technical users. We had to carefully balance statistical accuracy with intuitive UX, ensuring that teams felt empowered, not confused.
It also required close partnership across disciplines: data science, product, and design had to align deeply on thresholds, terminology, and trust. That alignment not only shaped this feature, it helped shift the broader culture toward more accessible, explainable product intelligence.