Design and Machine Learning: Driving Adoption Through Predictive Analytics
Summary
I helped design Amplitude’s first Anomaly Detection and Forecasting feature — a predictive analytics tool that helps users spot meaningful metric changes without manual guesswork. This feature reduced time-to-insight, built confidence in automated data interpretation, and empowered over 800 customer teams to identify significant shifts proactively and act faster with trust in their data.
Focus: Clarity, trust, and actionable insights
Role & Scope
Title: Sr Product Designer, Growth Team
I led design across research, prototyping, visualization, and interaction design, partnering with droduct, data science, and analytics teams to define a trustworthy, intuitive predictive feature.
Design Challenge
Design a scalable anomaly detection system that’s transparent, interpretable, and adaptable across user types — turning complex statistical modeling into clear, actionable insight.
Context
At Amplitude, I was part of the Growth team; a lean, high-impact group focused on validating ideas quickly before scaling them into the broader product roadmap. Our team de-risked big bets, prioritized high-value opportunities, and informed Amplitude’s long-term analytics strategy.
In March 2020, with hiring frozen due to COVID-19, the Growth team inherited an early-stage Anomaly Detection and Forecasting initiative. We were tasked with building a functional, validated foundation — fast. Working directly with customers, we prototyped and refined the initial experience, laying the groundwork for future expansion by the analytics organization. Amplitude’s users relied on the platform to track core product metrics. But existing methods for evaluating changes were manual and noisy, forcing analysts to chase fluctuations that often didn’t matter.
Our challenge: design a tool that could distinguish meaningful anomalies from statistical noise, helping users find real insights faster with confidence and clarity.
Key Responsibilities
- Collaborated with product analytics and data science to align thresholds with user trust and interpretability
- Designed the inline anomaly detection layer integrated into dashboards and charts
- Developed visualization models (tooltips, confidence bands, highlights) that reduced noise while surfacing insights
- Introduced forecast shading to represent expected ranges and deviations
- Defined and tested UX patterns for anomaly explanations, including confidence intervals and dynamic signifiers
Problem Details
Amplitude’s existing analytics tools made it easy to view metrics but hard to interpret meaningfully. Users wasted time investigating normal variation or missed important regressions entirely.
The Impact
- Teams delayed product decisions due to uncertainty
- Analysts and PMs spent hours validating false anomalies
- Non-technical users lacked trust in predictive outputs

Why It Mattered
Amplitude’s core value lies in helping teams understand why their metrics move, not just that they do. Without anomaly detection, teams spent hours investigating false regressions or missing real ones entirely. For enterprise clients, this meant wasted time, missed growth opportunities, and delayed product decisions.
By surfacing statistically meaningful changes in context, we could help:
- Analysts reduce manual workload and noise filtering
- PMs and growth teams make faster, data-backed decisions
- Amplitude strengthen trust in its analytics engine as a proactive, intelligent product
This was a chance to redefine what “insight discovery” meant for Amplitude’s customers, shifting analytics from descriptive to predictive.
Opportunity
Deliver an integrated anomaly detection experience that:
- Detects statistically significant changes automatically
- Explains model logic transparently to build trust
- Reduces time-to-insight and analyst dependency
- Scales to diverse user types, from data scientists to PMs and growth teams
The goal was to transform data interpretation from a reactive, manual process into an intuitive, predictive experience built around explainability and usability.
Goals
- Detect statistically significant changes in any time series
- Help users identify and respond to anomalies quickly
- Introduce forecasting capabilities for trend anticipation
- Drive product adoption through trust and transparency
- Build a scalable framework for predictive analytics
The Research Process
We conducted customer testing and in-depth interviews across product, data, and growth teams to understand how users identified, interpreted, and acted on anomalies.
Key Findings
- Ease of understanding: Users needed clarity at a glance: guided tooltips, accessible copy, and minimal friction.
- Transparency builds trust: Users wanted visibility into how anomalies were detected and confidence in underlying logic.
- Clarity in detection: Color and contrast needed to clearly distinguish meaningful data points.
- Guided configuration: Defaults should help users start confidently without requiring technical fluency.
A consistent friction point emerged: users didn’t understand the model’s parameters and often questioned whether they had configured it correctly.
"How do I trust Amplitude's tool more than my data scientist?"
To solve this, we leveraged Amplitude’s brand trust by introducing predefined modes — smart defaults aligned with common industry use cases.
Strategy
We structured the experience around smart defaults, progressive learning, and visual transparency.
- Mode-based interaction: Introduced three industry-aligned presets: agile, robust, and custom, allowing users to start confidently and refine as they learned.
- Simplified configuration: Minimized manual input while preserving flexibility for advanced users.
- Progressive disclosure: Showed only essential details upfront; deeper metrics and intervals revealed on hover.
- Explainability: Built visual affordances and hover explanations to help users understand why anomalies were flagged.
Solution
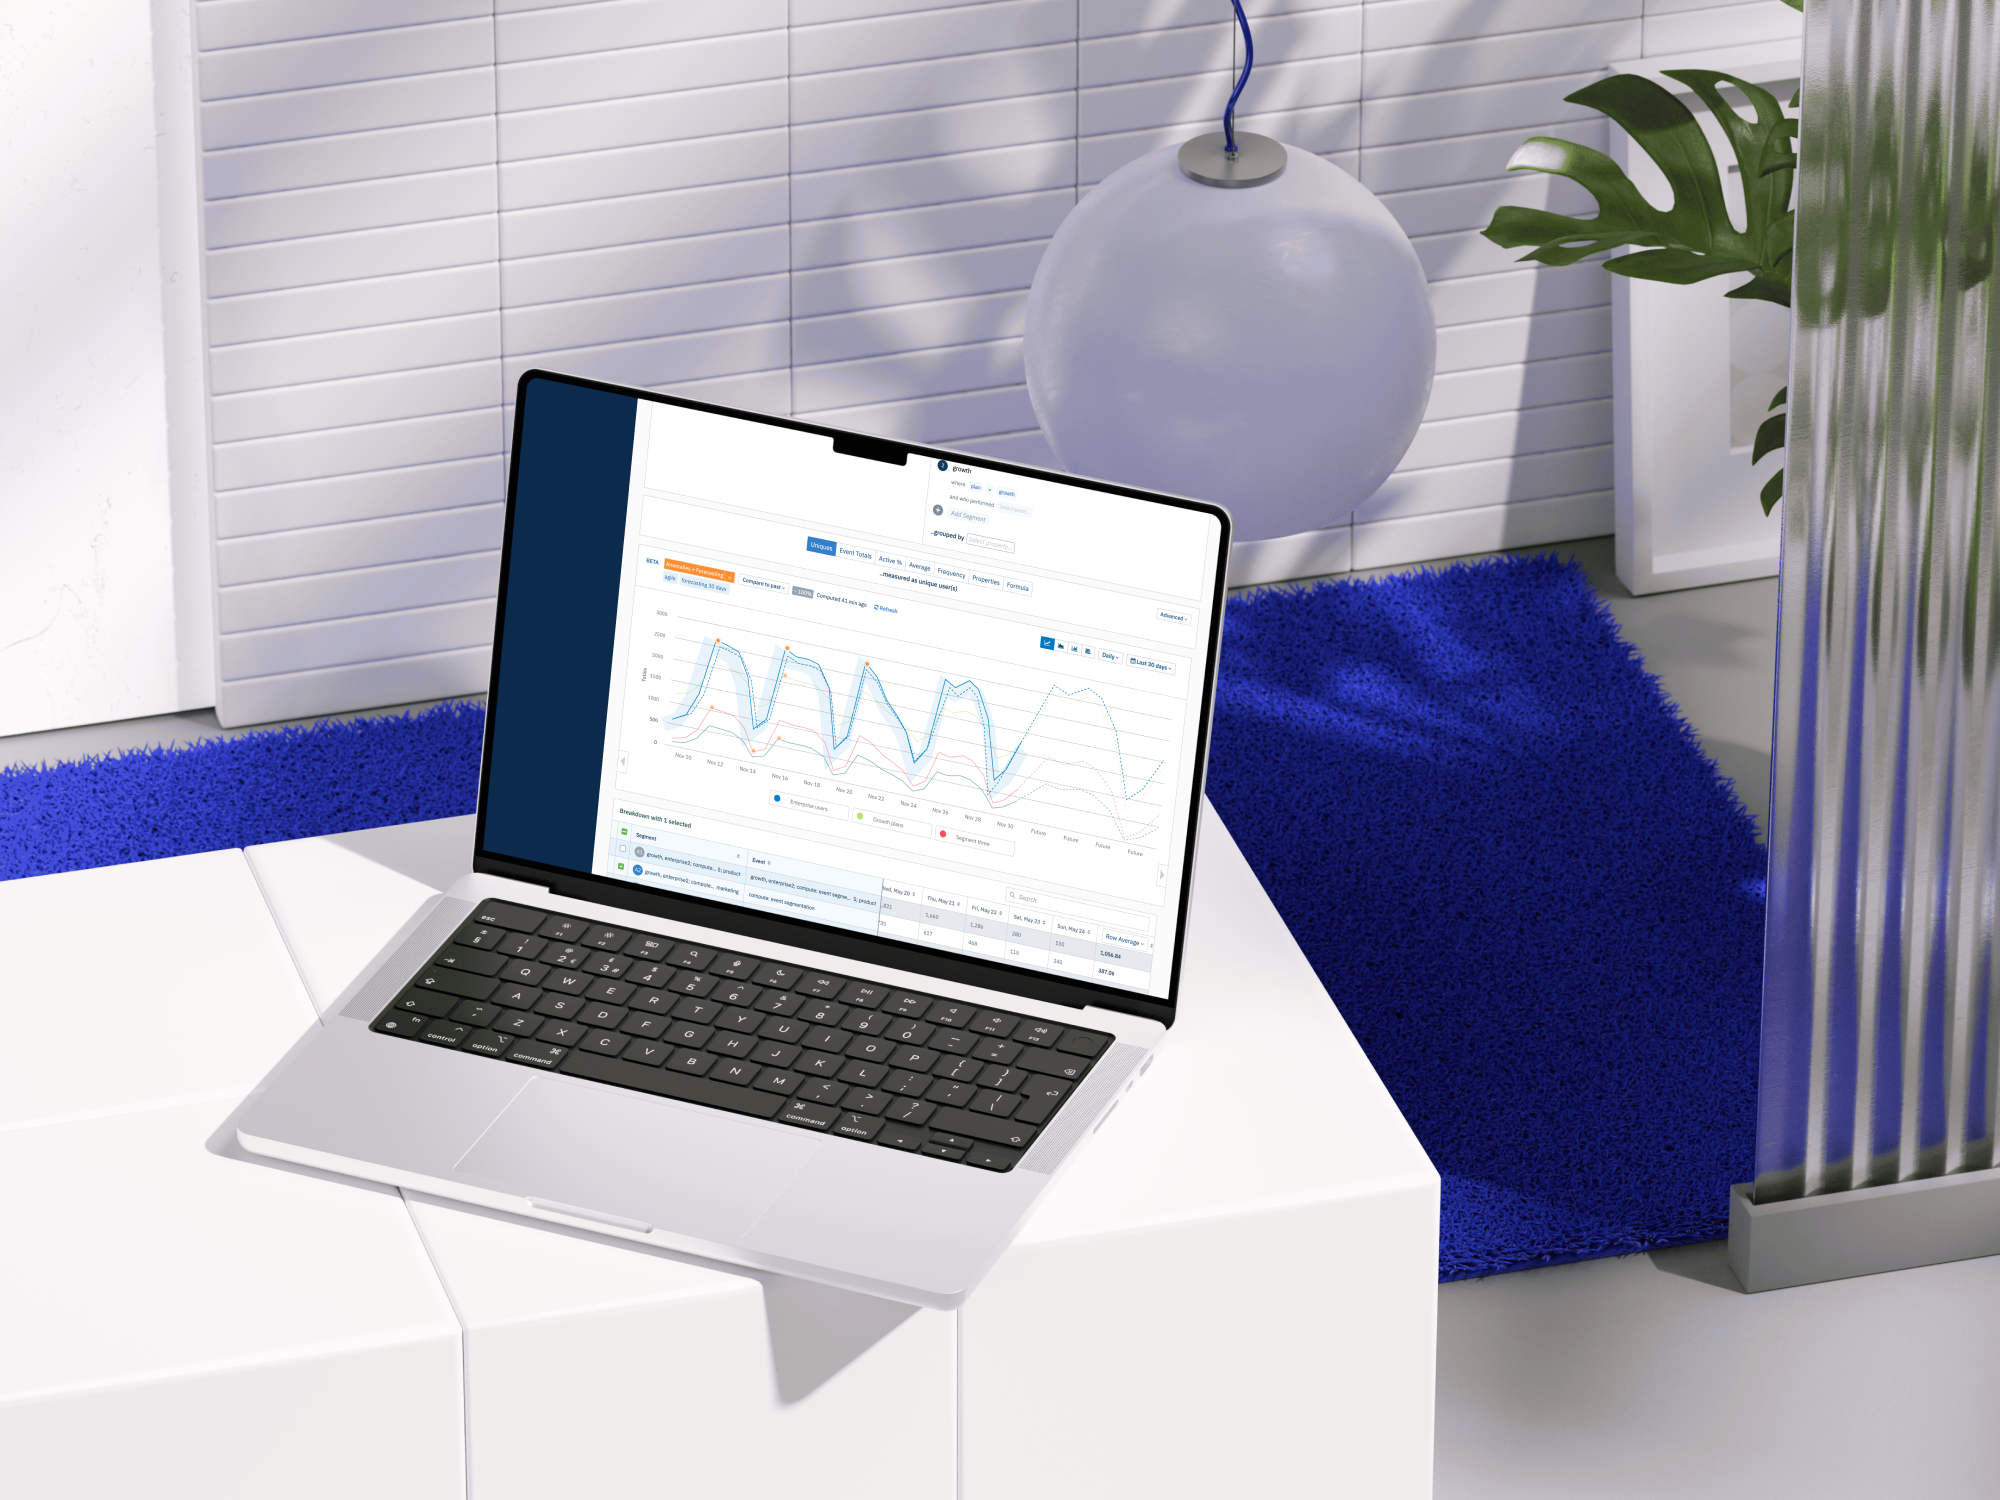
We launched Amplitude’s first Anomaly Detection & Forecasting feature with three user modes:
- Agile: Optimized for fast, recent insights (95% confidence, 120 days of data).
- Robust: Suited for seasonal metrics using one year of training data.
- Custom: For advanced users defining their own confidence intervals and durations.

Core UX Features
- Forecast ranges visualized directly on charts for immediate comparison
- Inline anomaly flags with hover-based details and contextual explanations
- Confidence indicators for severity and likelihood
- Drill-in patterns to explore root causes
- Transparent explanation UI showing why anomalies were triggered
Balancing Detail & Simplicity
To avoid clutter, the UI displayed up to 10 anomaly points by default. Hover states revealed deeper metrics, confidence bands, and parameters inline — preserving readability while supporting exploration. A dedicated color token was assigned exclusively to anomaly visualization, ensuring clarity in a dense blue-dominant interface.
Interaction Model
Instead of a binary toggle, we used a button activation model for mode selection. This pattern simplified interaction and maintained consistency with Amplitude’s broader design system.
- Clear color states indicated activation.
- Selecting a mode instantly applied defaults.
- Parameters could be adjusted inline via editable tags.


Outcomes
- 900 customer accounts in beta; 17% engaged through in-app prompts
- 1/3 of all paying customers (800+ teams) actively using the feature post-launch
- Reduced dependency on analysts for manual validation
- Faster reactions to metric changes across PM and growth teams
- Validated a new strategic analytics pillar focused on real-time detection, forecasting, and root-cause analysis
This project established Amplitude’s predictive analytics foundation — transforming reactive reporting into proactive insight discovery. By making statistical modeling transparent and approachable, we built user trust, reduced friction, and increased adoption across a diverse customer base.
Reflection
Designing for machine learning requires balancing human intuition with statistical precision. Trust comes from clarity — not just accuracy. By giving users visibility into how insights are generated, we turned a complex predictive system into a transparent, confidence-building experience that empowered thousands of teams to act faster and smarter.